
- 전체 (813)

| 일 | 월 | 화 | 수 | 목 | 금 | 토 |
|---|---|---|---|---|---|---|
| 1 | 2 | 3 | 4 | 5 | 6 | 7 |
| 8 | 9 | 10 | 11 | 12 | 13 | 14 |
| 15 | 16 | 17 | 18 | 19 | 20 | 21 |
| 22 | 23 | 24 | 25 | 26 | 27 | 28 |
| 29 | 30 | 31 |
Tags
- Spring
- javascript
- jenkins
- linux
- Web Server
- devops
- IntelliJ
- java
- JVM
- php
- ubuntu
- 요리
- Gradle
- Spring Boot
- tool
- db
- MySQL
- elasticsearch
- ReactJS
- Spring Batch
- 맛집
- Oracle
- Git
- springboot
- laravel
- it
- jsp
- redis
- AWS
- Design Patterns
Archives
- Today
- Total
아무거나
서킷브레이커(=Circuitbreaker) Resilience4j 적용 (Java + Spring Boot) 3편 본문
Java & Kotlin/Spring
서킷브레이커(=Circuitbreaker) Resilience4j 적용 (Java + Spring Boot) 3편
전봉근 2022. 7. 13. 13:20반응형
해당 포스팅은 2편인 이전 포스팅인 https://bkjeon1614.tistory.com/712을 참고하여 사전작업 후 진행하는것이 좋다. (모니터링 하는 방법에 대해서만 설명이 나오기 때문)
prometheus 란?
Prometheus는 이벤트 모니터링 및 경고에 사용되는 무료 소프트웨어 응용 프로그램입니다. 유연한 쿼리 및 실시간 경고와 함께 HTTP 풀 모델을 사용하여 구축 된 시계열 데이터베이스에 실시간 메트릭을 기록
- 풀 방식의 메트릭 수집, 시계열 데이터 저장
- promQL을 활용하여 저장된 시계열을 쿼리 및 집계
- promQL: 프로메테우스에서 실시간으로 시계열 데이터를 집계할 수 있는 함수형 쿼리 언어
- 서비스 디스커버리
- 데이터 시각화
grafana 란?
Grafana는 오픈소스 메트릭 데이터 시각화 도구이다. 2014년 Torkel Ödegaard 에 의해 시작되었으며 AWS CloudWatch, Azure Monitor 와 같은 클라우드 서비스나 InfluxDB, Elasticsearch 등 여러 데이터 소스를 지원하고 있다. 또한 Oracle, Dynatrace, dataDog 등의 외부 서비스들과도 통합을 지원하고 있다.
- 다양한 연동을 통해 대시보드(시각화)
- 시계열 데이터 말고도 log 및 trace도 시각화 가능
- 하나의 대시보드에 여러 Panel 및 자체 알림 기능등을 제공한다.(ex: email, slack 등..)
prometheus 연동을 위한 코드수정
먼저 모니터링을 위하여 https://bkjeon1614.tistory.com/712 까지 작업했던 코드를 일부 추가 및 변경하자.
- build.gradle 의존성 추가
[build.gradle]
  dependencies {
      ...
      runtimeOnly 'io.micrometer:micrometer-registry-prometheus'
      ...
}- application.yml 수정
[application.yml]
  # actuator
  management:
    endpoint:
      health:
        show-details: always
    endpoints:
      web:
        exposure:
          include: health, info, metrics, prometheus, retries  # actuator 노출 원하는 정보 선택
    health:
      circuitbreakers:
        enabled: true # circuitbreakers 정보 노출
      retryevents:
enabled: true # retryevents 정보 노출- 테스트용 컨트롤러 생성 (해당 테스트는 프로메테우스 수집 확인 용도이므로 완료 후 삭제해도된다. 나중에 실제 테스트는 이전 포스팅에서 만들었던 컨트롤러를 이용할 예정)
[PrometheusTestController.java]
  import org.springframework.web.bind.annotation.GetMapping;
  import org.springframework.web.bind.annotation.RestController;

  @RestController
  public class PrometheusTestController {

      @GetMapping("/end-point1")
      public String endPoint1() {
          return "Metrics for endPoint1";
      }

      @GetMapping("/end-point2")
      public String endpoint2() {
         return "Metrics for endPoint2";
      }

}- prometheus 의존성을 추가한 후 {domain}/actuator 로 접속하면 하기 이미지와 같이 prometheus 가 추가된 것을 볼 수 있다.

- prometheus.yml 작성
[prometheus.yml]
  # prometheus
  global:
    scrape_interval: 2s  # 10초마다 메트릭을 수집 (default: 1m)
    scrape_timeout: 10s # request 가 timeout 나는 길이 (default: 10s)
    evaluation_interval: 2m  # 2분마다 규칙 평가 (default: 1m)
    external_labels: 'app-monitor'
  scrape_configs:
    - job_name: 'app-monitor-job'
      metrics_path: '/api/actuator/prometheus'  # Application prometheus endpoint
      static_configs:
        - targets: ['host.docker.internal:9090']  # Application host:port
docker 에서 prometheus 실행
- 상기 prometheus.yml 을 작성했던 위치에서 docker 실행
Ex) docker run -d -p 9898:9090 -v /Users/lotte/bkjeon/study/java-example-code/bkjeon-mybatis-codebase/prometheus.yml:/etc/prometheus/prometheus.yml --name prometheus prom/prometheus --config.file=/etc/prometheus/prometheus.yml 로 실행하하여 상기 작성했던 prometheus.yml 을 공유하면 되는데 안될 경우 docker run -d -p 9898:9090 -v /Users/lotte/bkjeon/study/java-example-code/bkjeon-mybatis-codebase/prometheus.yml --name prometheus prom/prometheus --config.file=/etc/prometheus/prometheus.yml 명령으로 실행하여 직접 컨테이너 콘솔로 들어가 vi /etc/prometheus/prometheus.yml 에서 상기 prometheus.yml 내용을 입력하자. $ docker run -p 9090:9090 -v {상위경로}/prometheus.yml:/etc/prometheus/prometheus.yml --name prometheus prom/prometheus --config.file=/etc/prometheus/prometheus.yml - http://localhost:9898/ 접속하면 prometheus 확인이 가능하다.
- 검색어에
jvm_momory_used_bytes를 입력하고 조회하면 메트릭 정보를 얻을 수 있다.


docker 에서 grafana 실행
- 명령실행
$ docker run -d --name=grafana -p 9988:3000 grafana/grafana - grafana 템플릿 다운
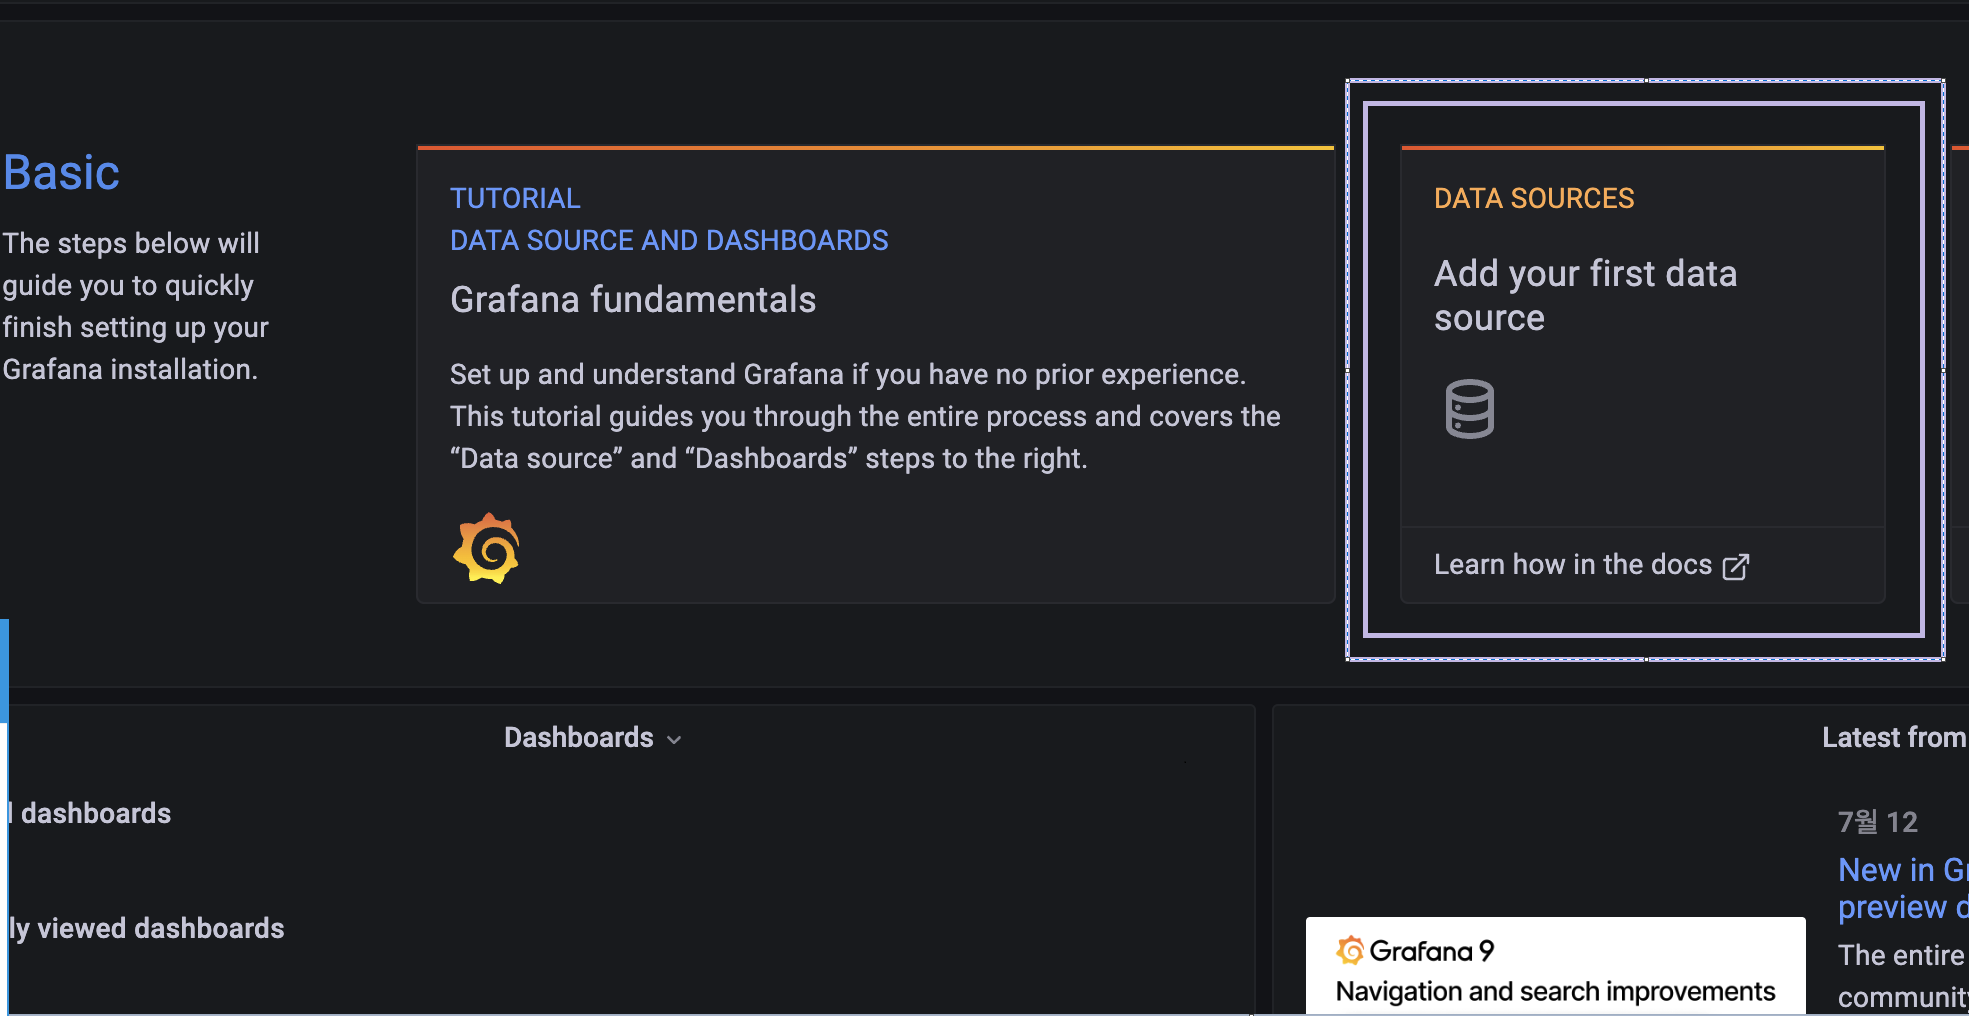
- http://localhost:9988 로 grafana 접속후 로그인 (초기계정정보: admin / admin)
- 첫 페이지에서
DATA SOURCES클릭
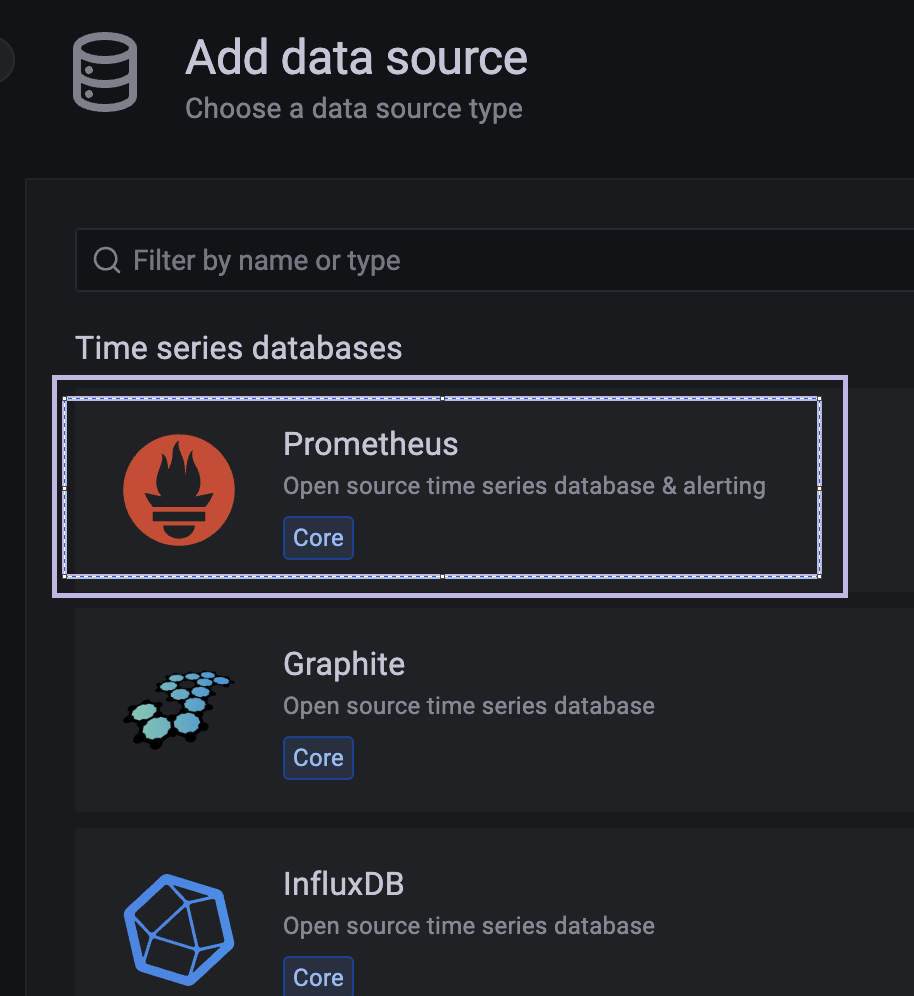
- 그 다음
Prometheus클릭
- Data Source 이름을 지정하고 하단의 URL 에
http://host.docker.internal:9898(프로메테우스 URL) 을 입력하고 하단 Save & Test 클릭 후 녹색으로 완료되는 표시를 확인하자.
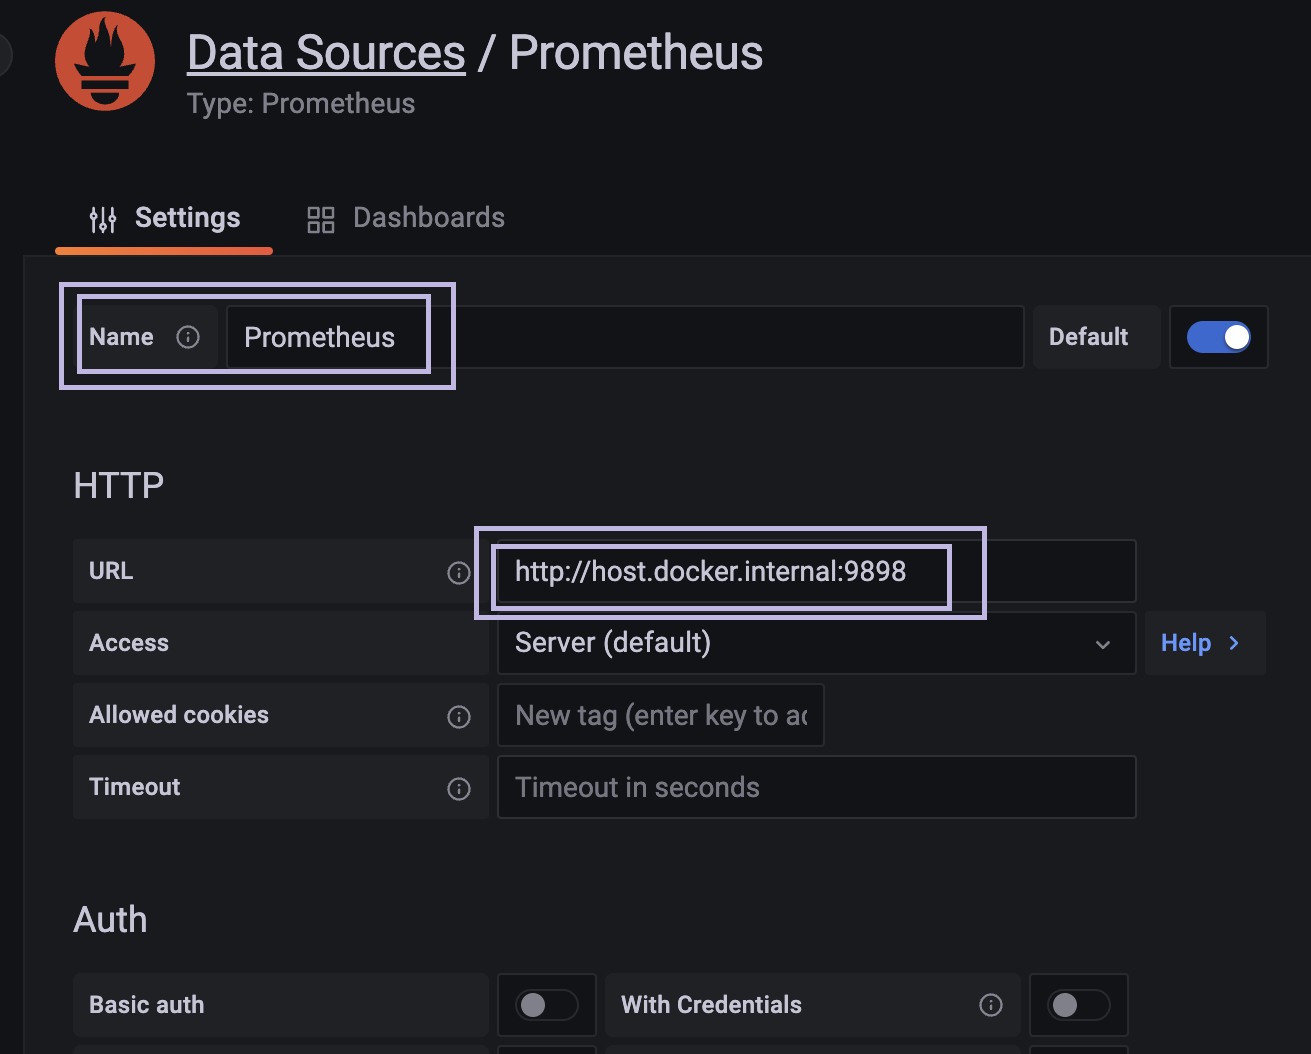
- 간혹 애플리케이션 URL로 잘못 입력해서
/api/v1/query호출 에러가 발생하는데 해당 url path 는 프로메테우스 http api path 이다. https://prometheus.io/docs/prometheus/2.32/querying/api/ - Grafana 템플릿 import
- 좌측 메뉴의 Dashboards > import > Upload JSON file 에 상기 다운받았던
grafana_dashboard.json을 업로드 > import 최종 클릭하면 적용된 화면을 볼 수 있다.
- 좌측 메뉴의 Dashboards > import > Upload JSON file 에 상기 다운받았던

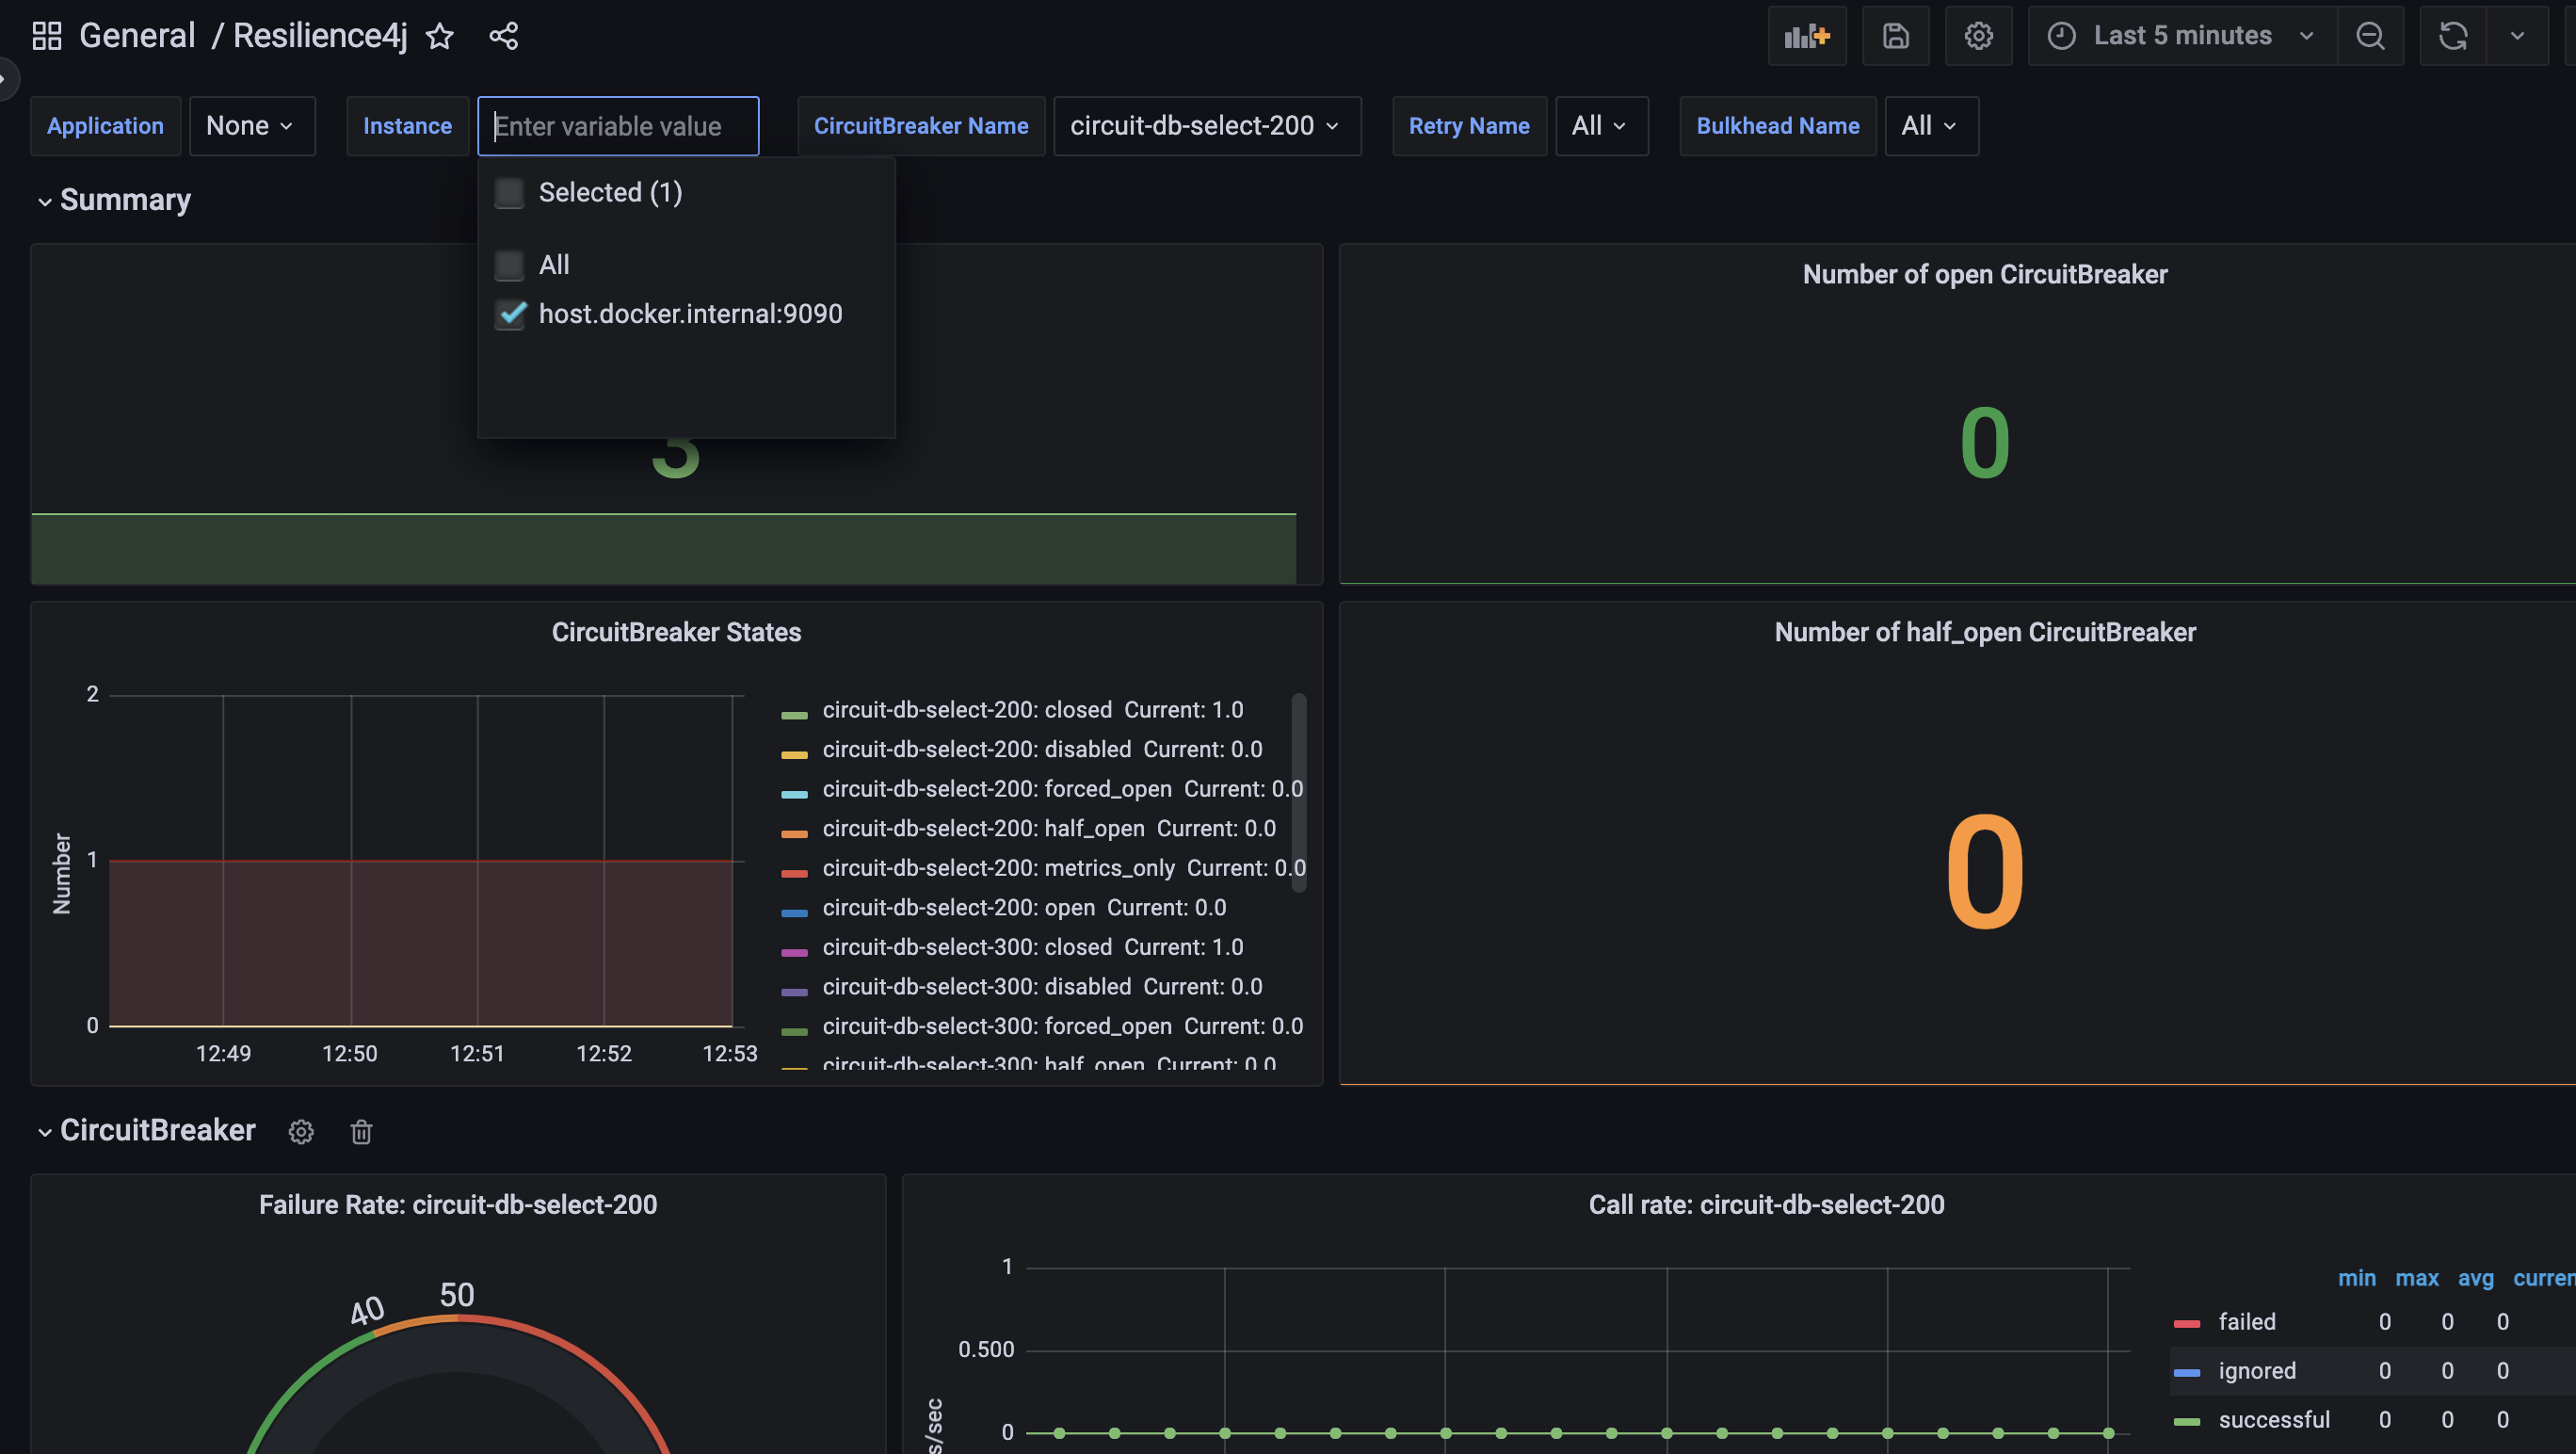
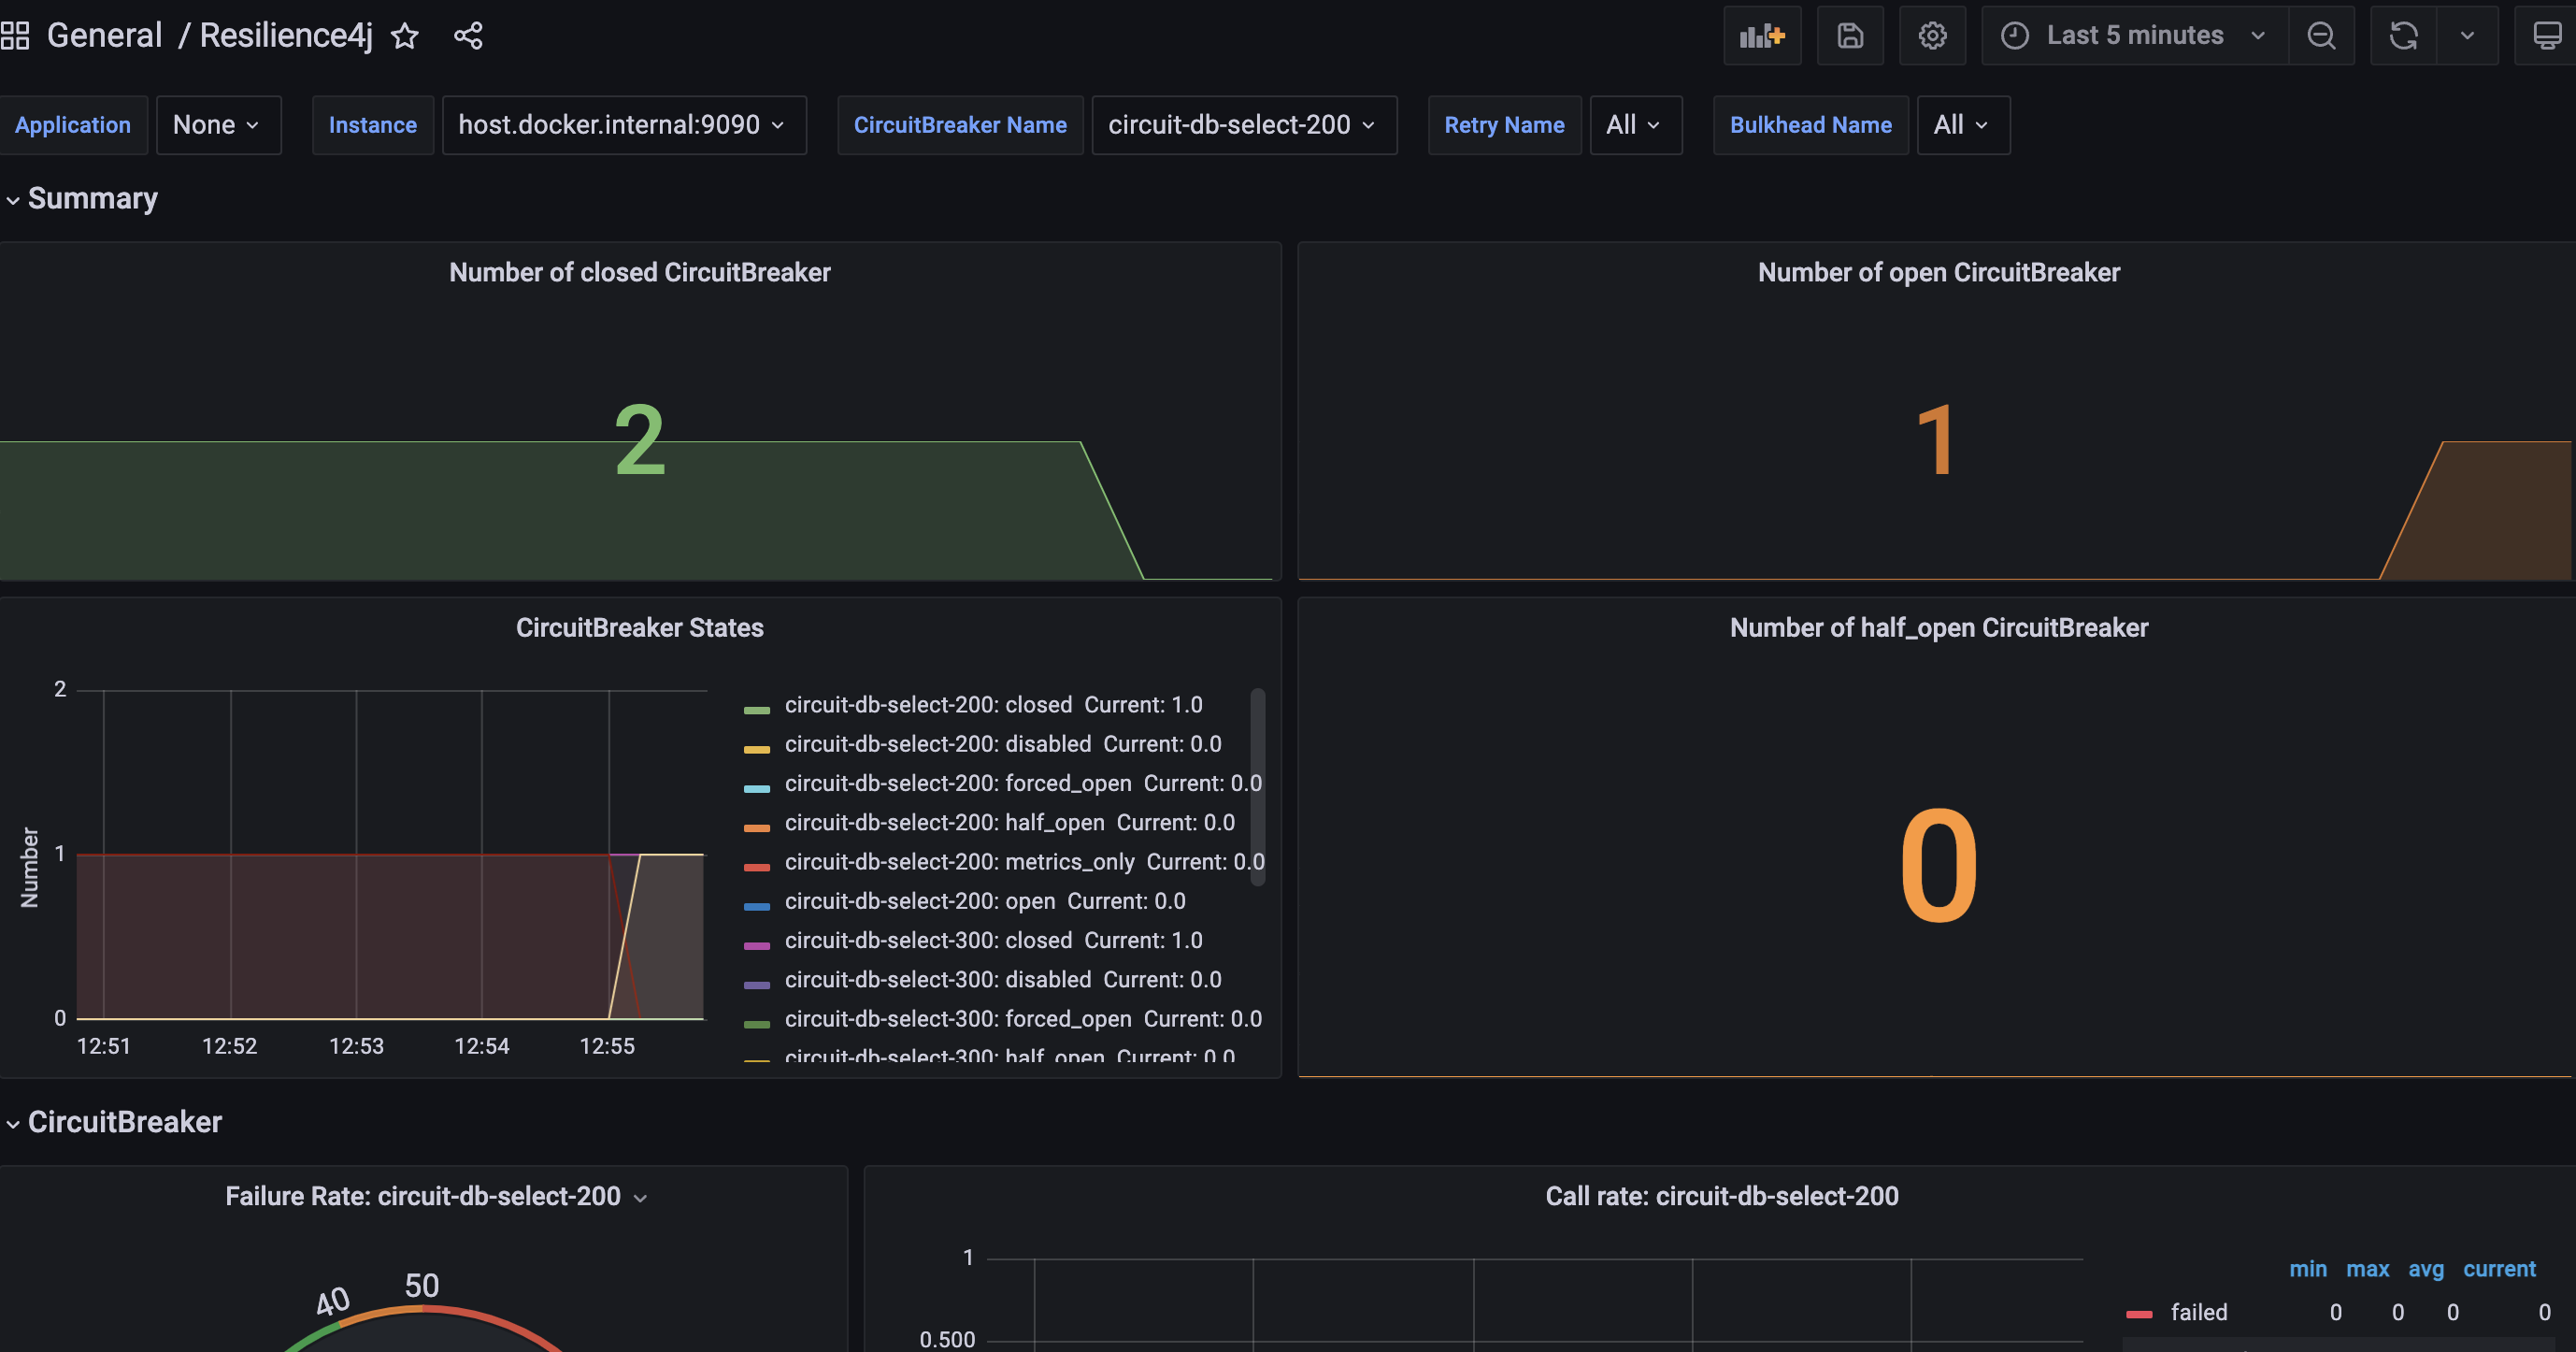
- 이전 포스팅들에서 설정했던 서킷브레이커 및 retry 등의 API 를 실행하면 서킷 오픈 등의 내용을 확인할 수 있다.
끝.
반응형
'Java & Kotlin > Spring' 카테고리의 다른 글
'Java & Kotlin/Spring' Related Articles
more


Comments